Incidents
The Incidents area is where your team logs and tracks security and operational events from first detection through triage and resolution.
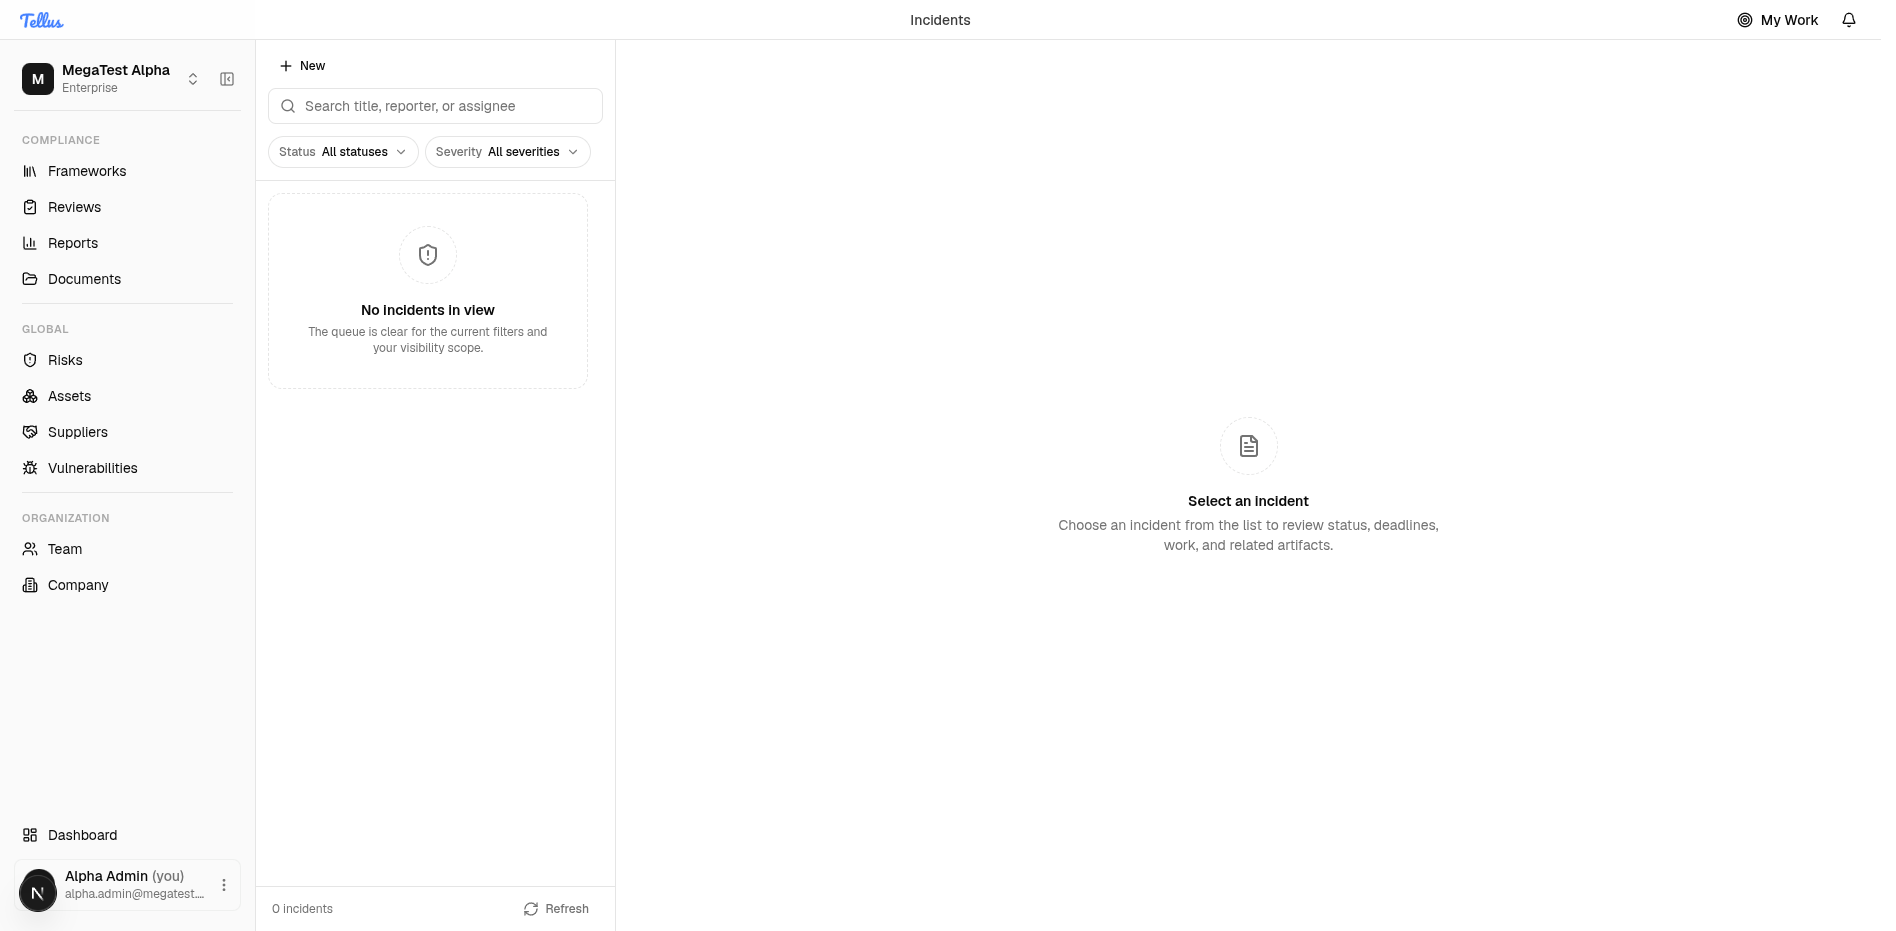
The Incidents area is where your team logs and tracks security and operational events from first detection through triage and resolution. It pairs a filterable incident queue on the left with a detail panel on the right, so you can scan everything that needs attention and drill into any single incident.
As a new user, you'll start by reporting an incident through a short structured form that captures the essentials needed to begin triage. You can reach the area from the Incidents link in the sidebar, or by going to /incidents directly.
Open the Incidents queue
- Open the Incidents page using the Incidents entry in the sidebar, or navigate to
/incidentsdirectly. - Use the search box to find incidents by title, reporter, or assignee.
- Narrow the list further with the Status and Severity dropdown filters at the top.
- Click any incident in the list to load its details in the panel on the right.
If the queue shows "No incidents in view" and the count reads "0 incidents", it simply means nothing currently matches your filters or your visibility scope. The detail panel will prompt you to "Select an incident" until you pick one.
Tip: An empty queue isn't an error. Try clearing your search text or resetting the Status and Severity filters to widen what you can see.
Open the Report incident form
- Click the New button at the top of the queue.
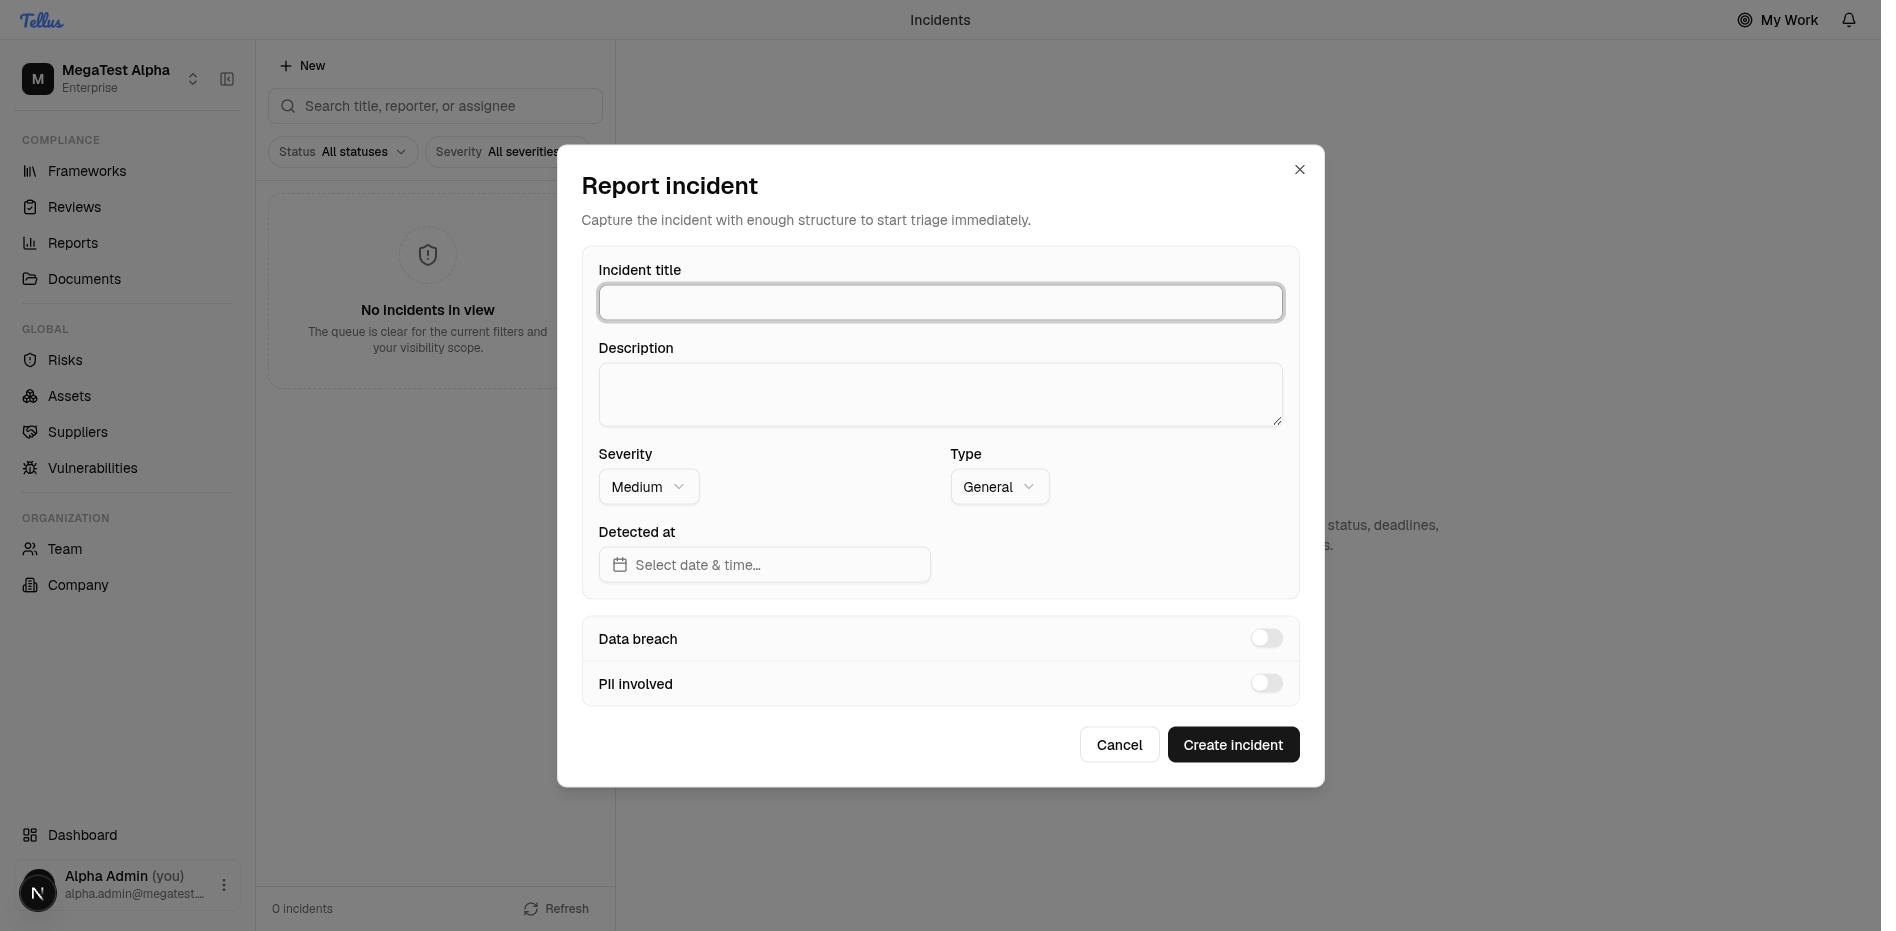
- The Report incident dialog opens. This is your starting point for logging anything that needs investigation.
The form includes:
- Incident title — a short name for the event.
- Description — what happened and what you know so far.
- Severity — Low, Medium, High, or Critical (defaults to Medium).
- Type — General, Data breach, Service disruption, Security incident, Supply chain, or Physical (defaults to General).
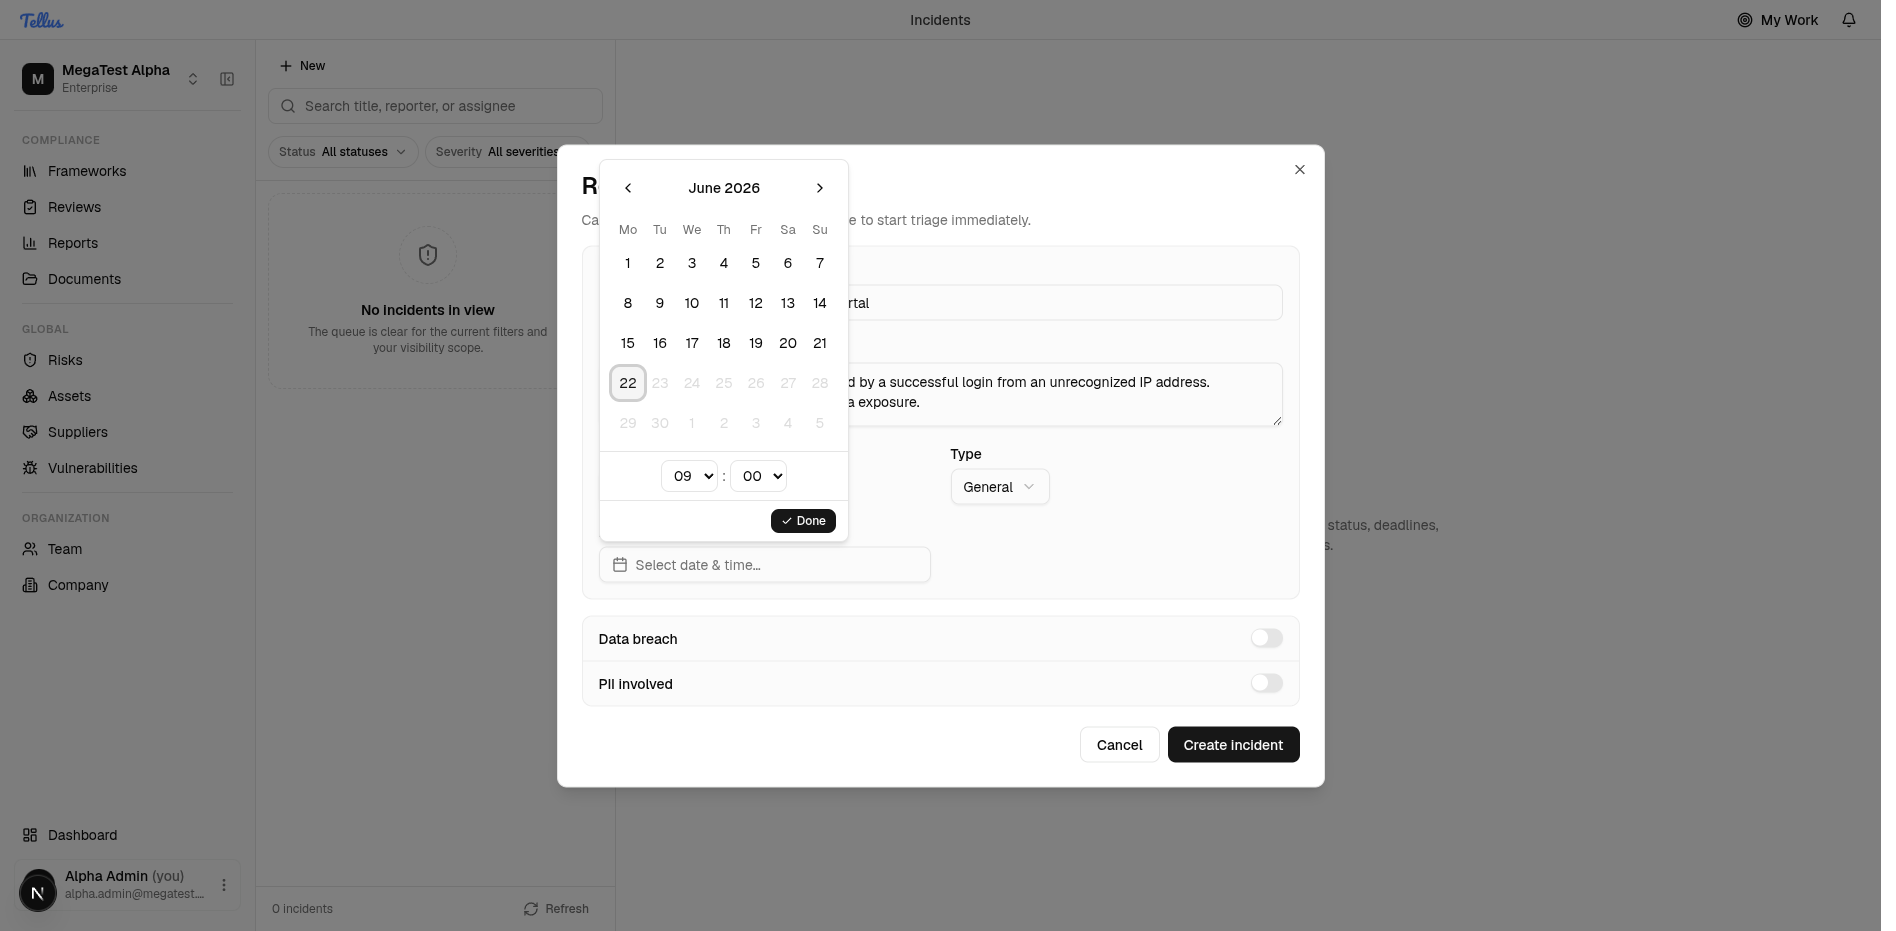
- Detected at — a date-and-time picker for when you became aware of the incident.
- Data breach and PII involved toggles — switch these on if breached or personal data is involved.
At the bottom you'll find Cancel and Create incident buttons.
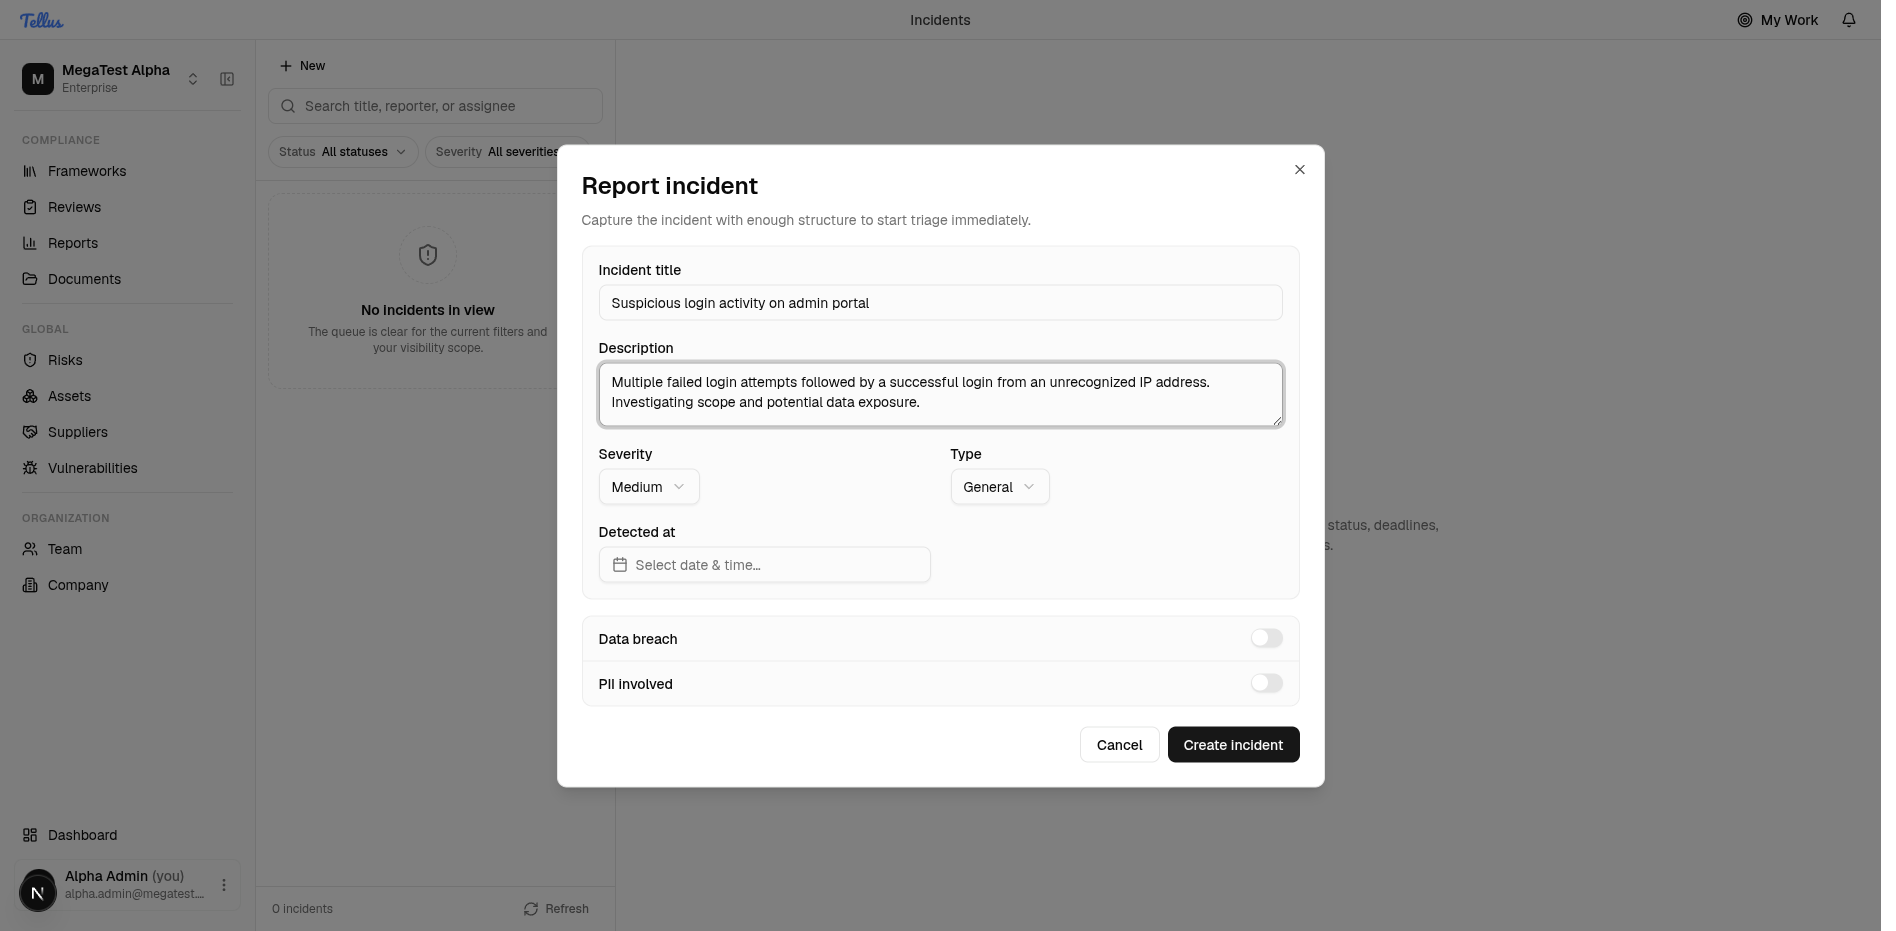
Fill in the incident details
- Enter a short, descriptive title.
- Write a clear description of what happened and what you currently know.
- Set the Severity and Type to match the situation.
- Flip the Data breach or PII involved toggles on if personal or breached data is involved.
- Set the Detected at date and time (see the next section).
- Click Create incident to add it to the queue, or Cancel to discard.
The goal here is enough structure to start triage immediately, not a complete write-up. You can keep editing the incident after it's created.
Tip: Don't wait until you have all the facts. Capture what you know now and refine the incident later.
Set when the incident was detected
- Click the Detected at field to open the calendar.
- Use the month navigation arrows to move between months if needed.
- Choose the day (and time) you became aware of the incident.
You can only pick today or an earlier date. Future dates are greyed out and can't be selected, because an incident can only have been detected in the past or today. Accurate detection times help track response deadlines later.